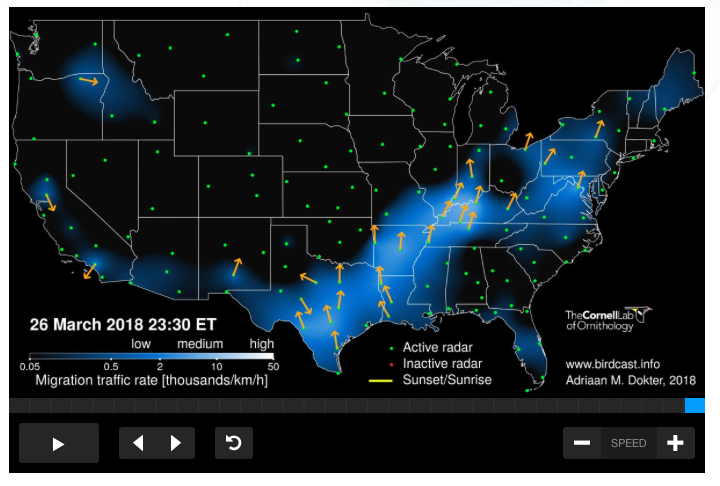
A 24-hour national mosaic animation of radar imagery featuring large numbers of birds taking flight. Circular blue and green features represent bird migration; precipitation appears as irregular bands. (Base reflectivity radar imagery from October 16th-17th, 2017, 12pm-12pm EST.)
Doppler weather radar data—like those shown in the animation above and often featured in weather broadcasts—can tell us much more than how much rain will fall on your weekend cookout.
Here at BirdCast, we turn weather radar data into information on the numbers and flight directions of birds aloft in order to expand the understanding of migratory bird movement. We have been hard at work serving you products, like the new migration forecast and live migration maps. After several years (and hundreds of posts) describing migration, species on the move, and unique migration events, we want you to have a better understanding of what happens at BirdCast. In this article, we’ll give you a brief overview and a behind-the-scenes look at the ways we apply radar data to study bird migration.
Check out our FAQ for more in-depth explanations of our work.
MORE THAN WEATHER
Radar, an acronym for radio detection and ranging, was originally developed to detect enemy aircraft in World War II. As the decades have passed, it has become a valuable tool for studying all kinds of objects in the atmosphere. One of radar’s most common applications is the detection of meteorological events—especially thunderstorms, tornados, and hurricanes. But there are other applications. The same radars that meteorologists use to estimate rainfall rates are equally adept at detecting other objects in the atmosphere, like birds.
From the earliest years of radar development, engineers and operators noticed dots on their screens that confused them. These targets did not correspond to any weather condition or aircraft and were dubbed “angels” in honor of their transient nature. And confusion about these targets arose for good reason: radar captures information about anything in the atmosphere that can scatter its pulsed microwave energy back to it. Meteorological phenomena share the sky with objects both human and biological, from aircraft and Saharan dust to hordes of mayflies and forest fire smoke plumes. These pioneering engineers and operators were the first to realize that radars could detect objects well beyond the intended range of aircraft and meteorological phenomena.
A massive horde of mayflies seen on radar in the upper Midwest. (Base reflectivity radar imagery from July 11th, 2017.)
Sorting out the identity of these “angels” was incredibly important, especially during wartime, where ignoring a detection could literally mean life or death. Edward Gray and David Lack, skilled field observers and premier ornithologists, in short order, hypothesized that the returns could be caused by birds. Eventually, the pair determined that birds were the culprit. So began the era of radar ornithology.
Purple Martins leave their roosts, causing an iconic radar ring. (Base reflectivity radar imagery from August 4th, 2017.)
Fast forward five decades to the 1990s, when technological advances of Next Generation Radar (NEXRAD) became operational in the U.S., allowing the field of radar ornithology to truly take flight. By this time, many knew that a large component of targets on radar were birds aloft on their bi-annual migrations, but the computer power, data storage, and computer algorithms needed to parse out birds from meteorological phenomena in radar data did not exist. Data were difficult to access and manipulate, and computers took hours—days, on occasion—to retrieve and process information of ornithological importance. In recent years, faster, more efficient, and more effective computing power, coupled with an invaluable upgrade in NEXRAD technology, provided the tools to extract avian information. In 2013, NOAA deployed a new feature to U.S. radars called “dual polarization” (dual-pol, for short)—pulses of microwaves emitted at two angles instead of one. Radars outfitted with dual-pol allow for better discrimination of targets. For meteorologists, dual-pol data provide an ability to distinguish partially frozen sleet from droplets of rain; for ornithologists, they allow us to more easily separate birds from precipitation and other flying creatures.
…BUT, HOW DO WE KNOW THESE ARE BIRDS?
Equipped with computing power and advanced radar technology, we can begin to provide detailed data on avian activity in the atmosphere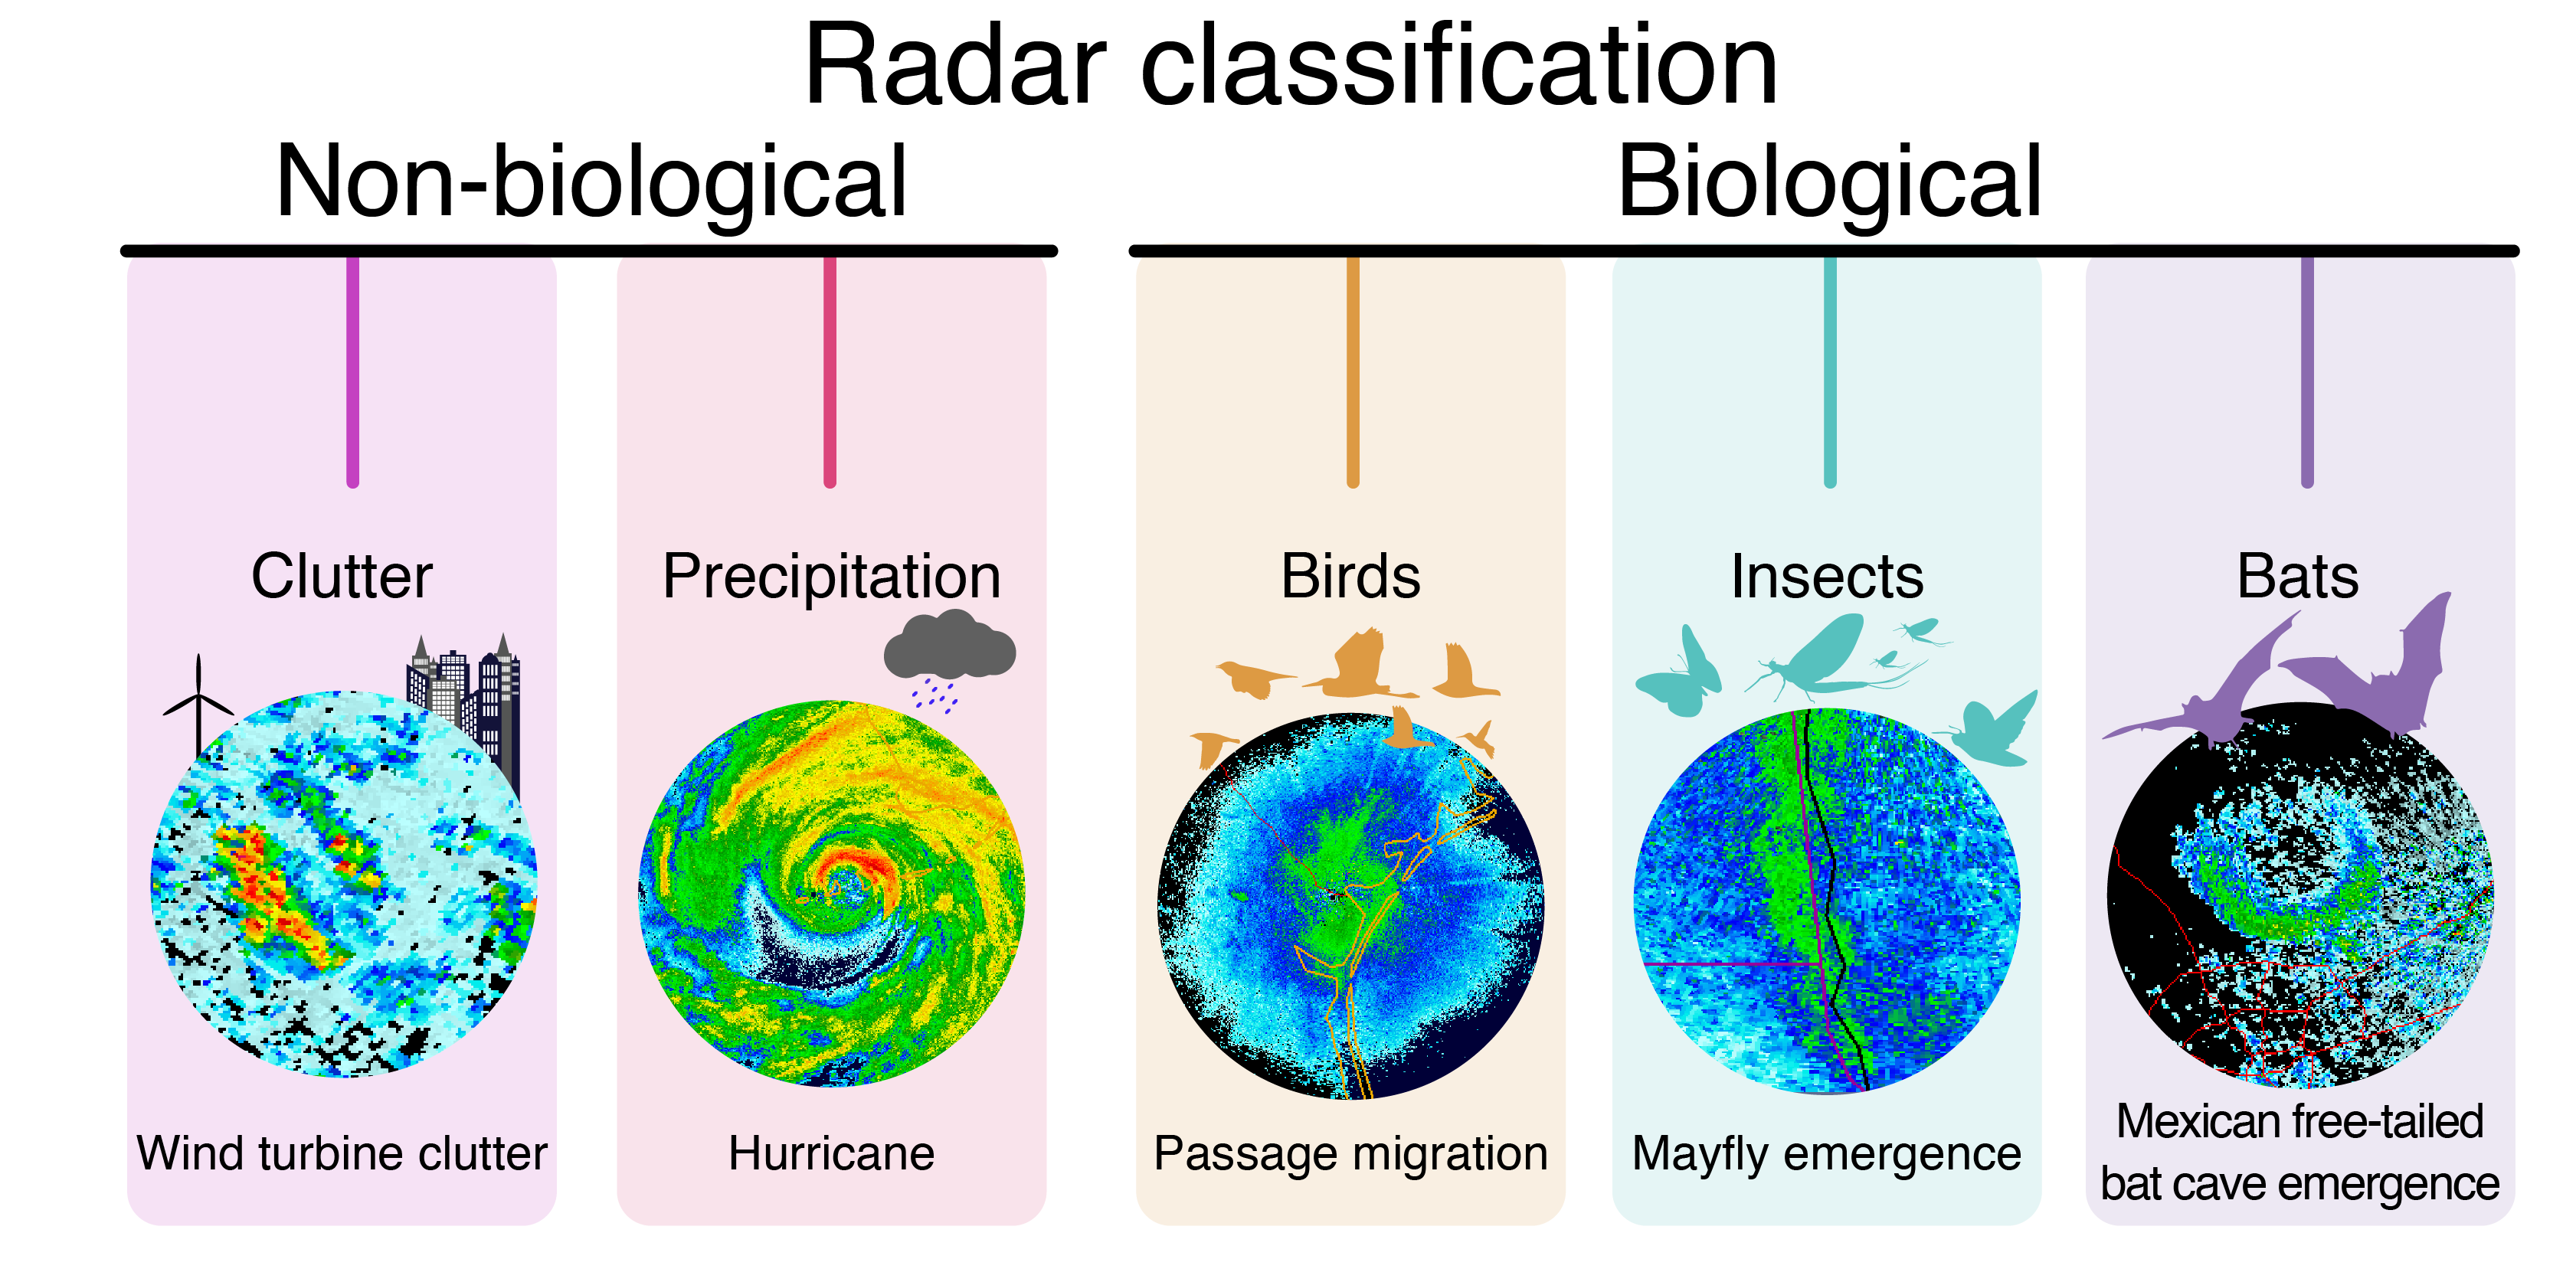
NON-BIOLOGICAL
Meteorological objects (rain, snow, sleet, and the like) are the most common targets found in radar data. Their detection is the primary goal of NEXRAD systems, and quality control filters have been created to remove distracting data. Such distractions include “false echoes” from ground clutter (wave reflections from nearby buildings/trees) and from waves bent towards the Earth’s surface (a somewhat rare phenomenon caused by changes in air temperature). False echoes have been muddying radar observations since the technology’s inception, and highly sophisticated algorithms can remove most of these echoes from the data.
BIOLOGICAL
Biological data—which is somewhat helpful to those tracking movements of the atmosphere but distracting to meteorologists—are not as easy to remove from radar data. Changes in time and space for airborne biology make automatic removal of returns from birds, bats, and insects challenging. However, these data are the primary currency of science for the BirdCast team! Using meteorologists’ “discarded” data, we meticulously attempt to characterize the biology of the atmosphere and to distinguish birds from insects and bats.
INSECTS
Both insects and birds rely on winds to help enhance their flight, but insects—given their small sizes—are generally more reliant on a boost from the wind. As a result, most insects travel in directions more aligned with winds (e.g. they drift or travel with the wind). Birds, however, have the ability to propel themselves at higher speeds and across (and even against!) winds. As a result, radar targets that are moving in a different direction than winds can be more readily attributed to birds.
BATS
For bats, we have a bigger challenge—flight speed and behavior do not easily distinguish bats from birds. Luckily, many birds and bats follow well-documented schedules, providing us with information on where and when to look. Birds initiate migration activity around 30-45 minutes after local sunset during spring and fall, whereas many bats set out on their foraging flights during the summer months. As a result, seasonality plays a major part in the analysis of datasets. This is not a perfect way to distinguish birds and bats by any means. For example, during the spring in the southern U.S. large numbers of bats overlap in space and time with large numbers of birds. But . . .
BOTH BATS AND INSECTS
. . . to help distinguish birds from both bats and insects, our team also looks at the size, shape, and intensity of radar returns. With the latest in processing capabilities allowing us to examine the entire archive of weather surveillance radar data for the U.S., we can look for the telltale signatures of bats emerging to forage from caves and map these for the future. We can also start to study how other patterns may allow us to separate birds and bats.
For example, certain species of birds like Purple Martins are prone to assemble in massive nocturnal roosts before and during migration. When these birds take to the sky, their activity produces a unique “ring”; a similar ring is seen when thousands of bats leave a cave. However, by relying on our knowledge of when and where Purple Martins are—and other migratory birds with similar roost behavior— we can attribute certain rings to bats and other rings to birds.
SEE FOR YOURSELF!
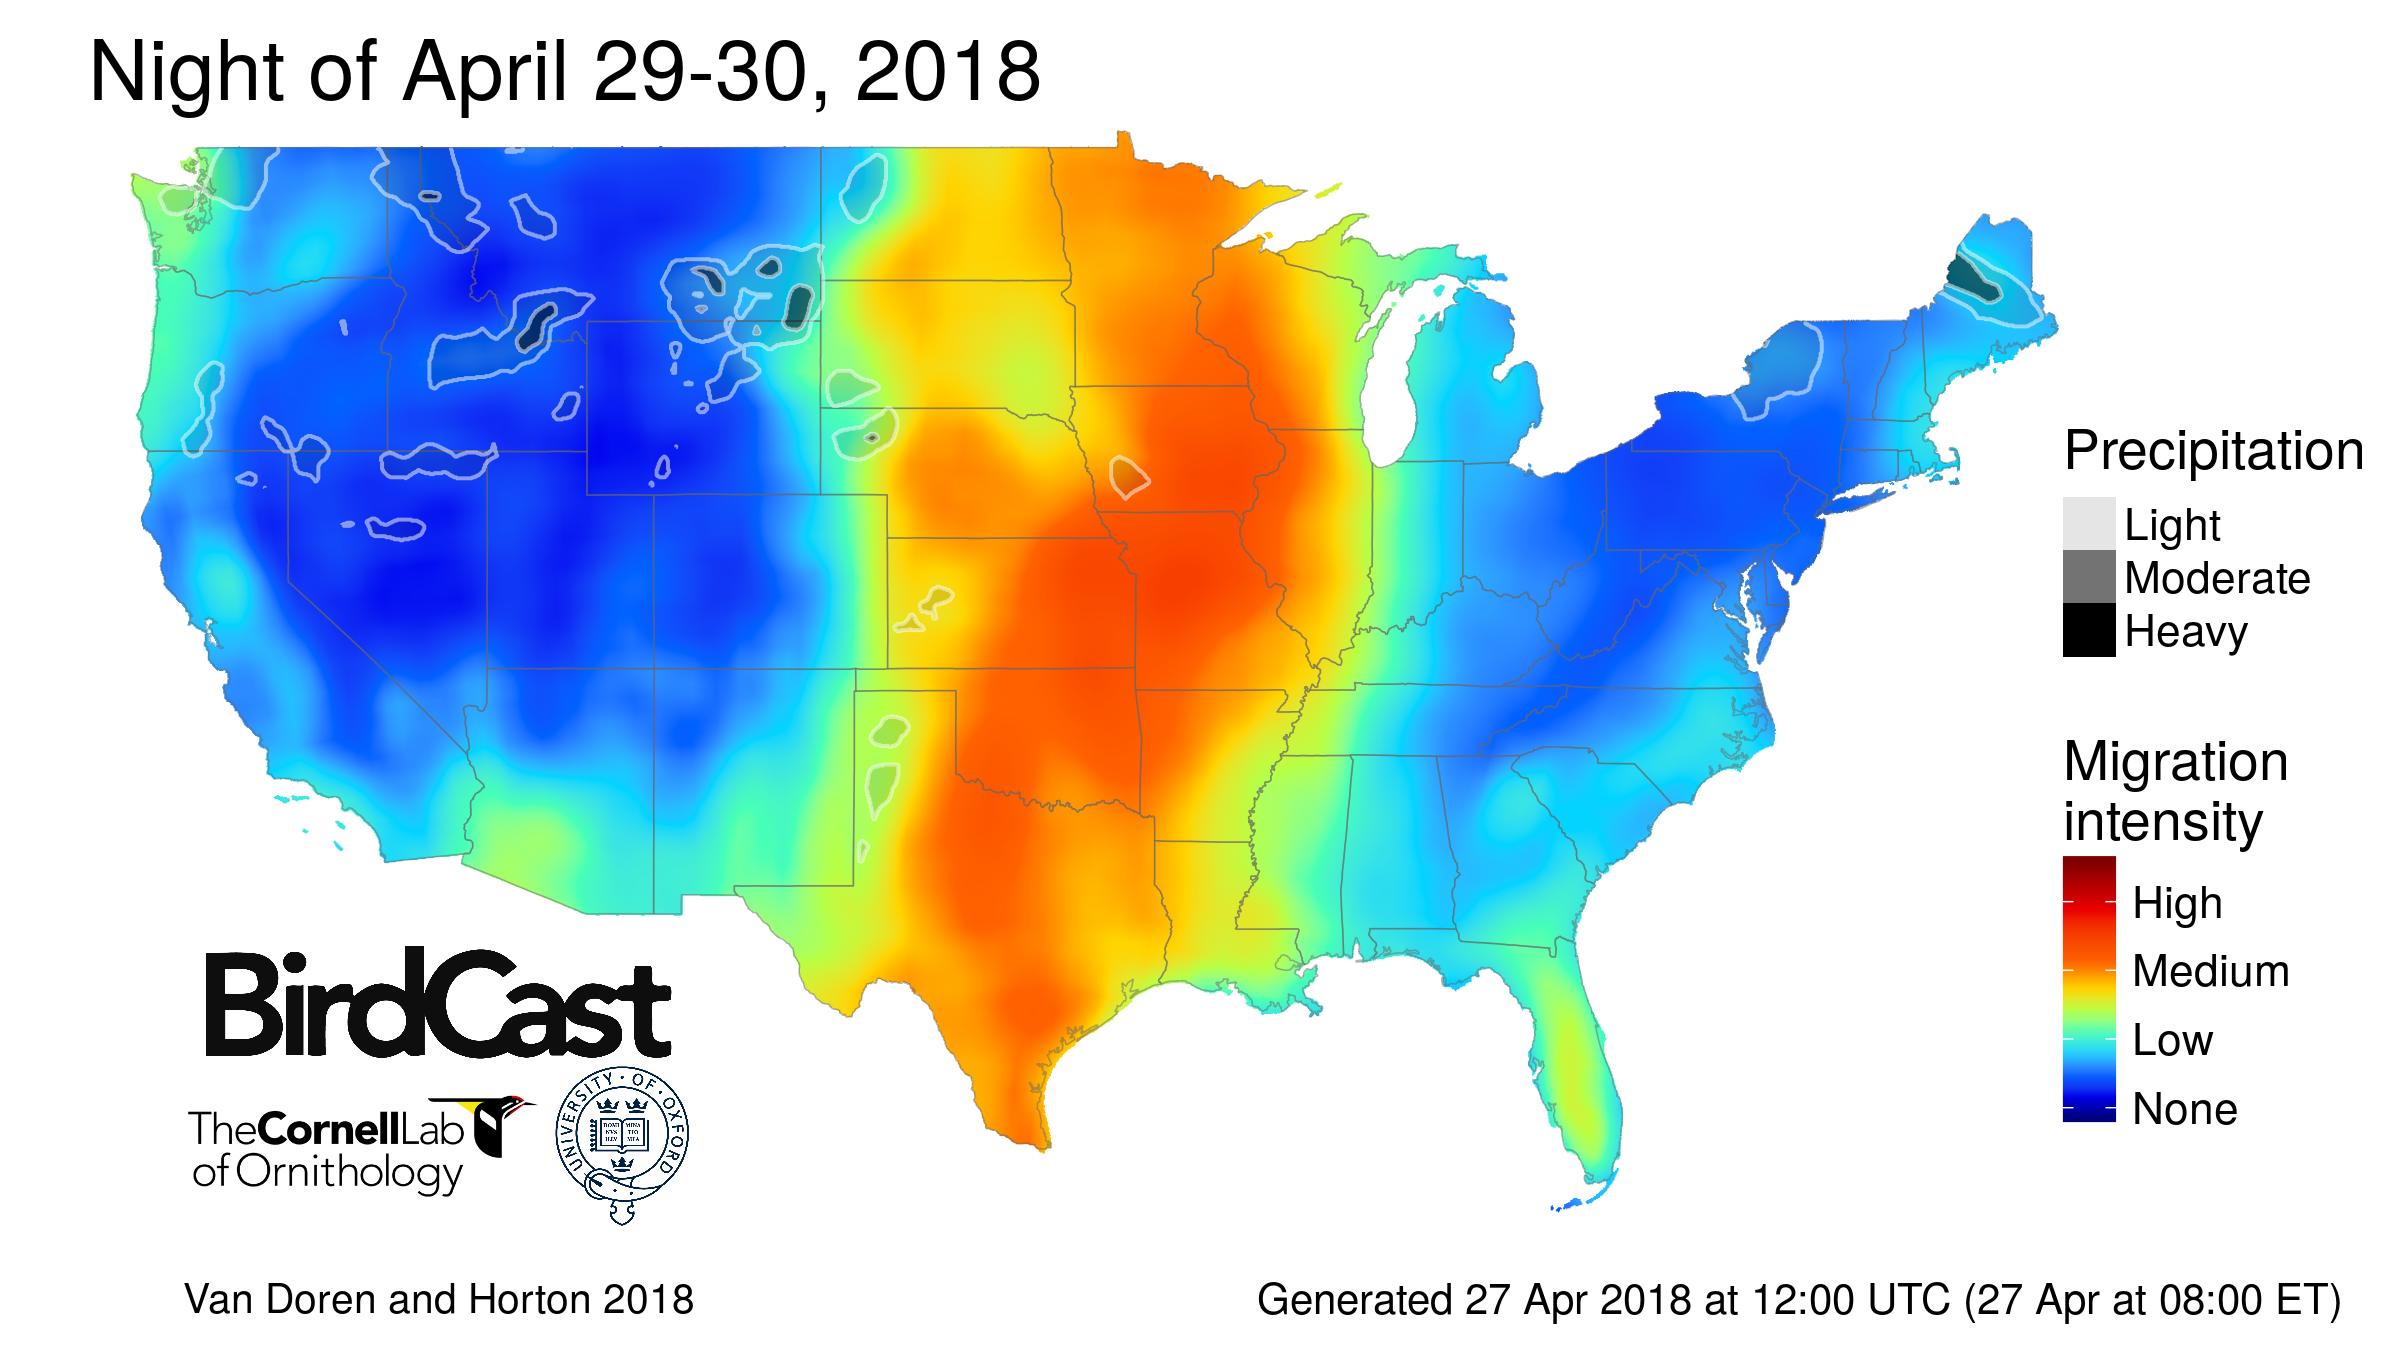
Once our algorithms identify birds in radar data, we pass on our knowledge to you through BirdCast forecasts and live migration maps. In brief, the brighter the color displayed, the more birds moving through that area.
Want to learn more about how to read our graphics? Click here.
 |
 |
WE NEED YOUR HELP!
The BirdCast team, along with other radar ornithologists, uses a broad array of tools to make sense of a treasure trove of information collected by radars about birds, such as migration density, flight speed, and direction. Our data are not complete, though. Many advances in radar technology have aided in our abilities to differentiate birds from rain and from other fliers, but more innovation is still necessary before we can distinguish unique species of birds. But all is not lost!
We learn much by integrating your eBird observations with radar data. Your records help to identify the likely composition of the birds detected in radar data—and to clarify that we are, indeed, looking at birds.
Here is an excellent example of how we can confirm radar returns via in-person observations, otherwise known as “ground-truthing.” Matthew Van Den Broeke and a crew of 30 other birders had a monumental day. Directly over these birders, an estimated 50,000 Purple Martins came to roost for the night in Oklahoma City. A checklist like this helps radar ornithologists to ground-truth radar imagery. On July 25th, Van Den Broeke’s martins—migrants known for their distinct radar returns—were detected in Oklahoma City as they left their nightly roost, taking to the sky to forage for the day.
Check out the video below to see for yourself!
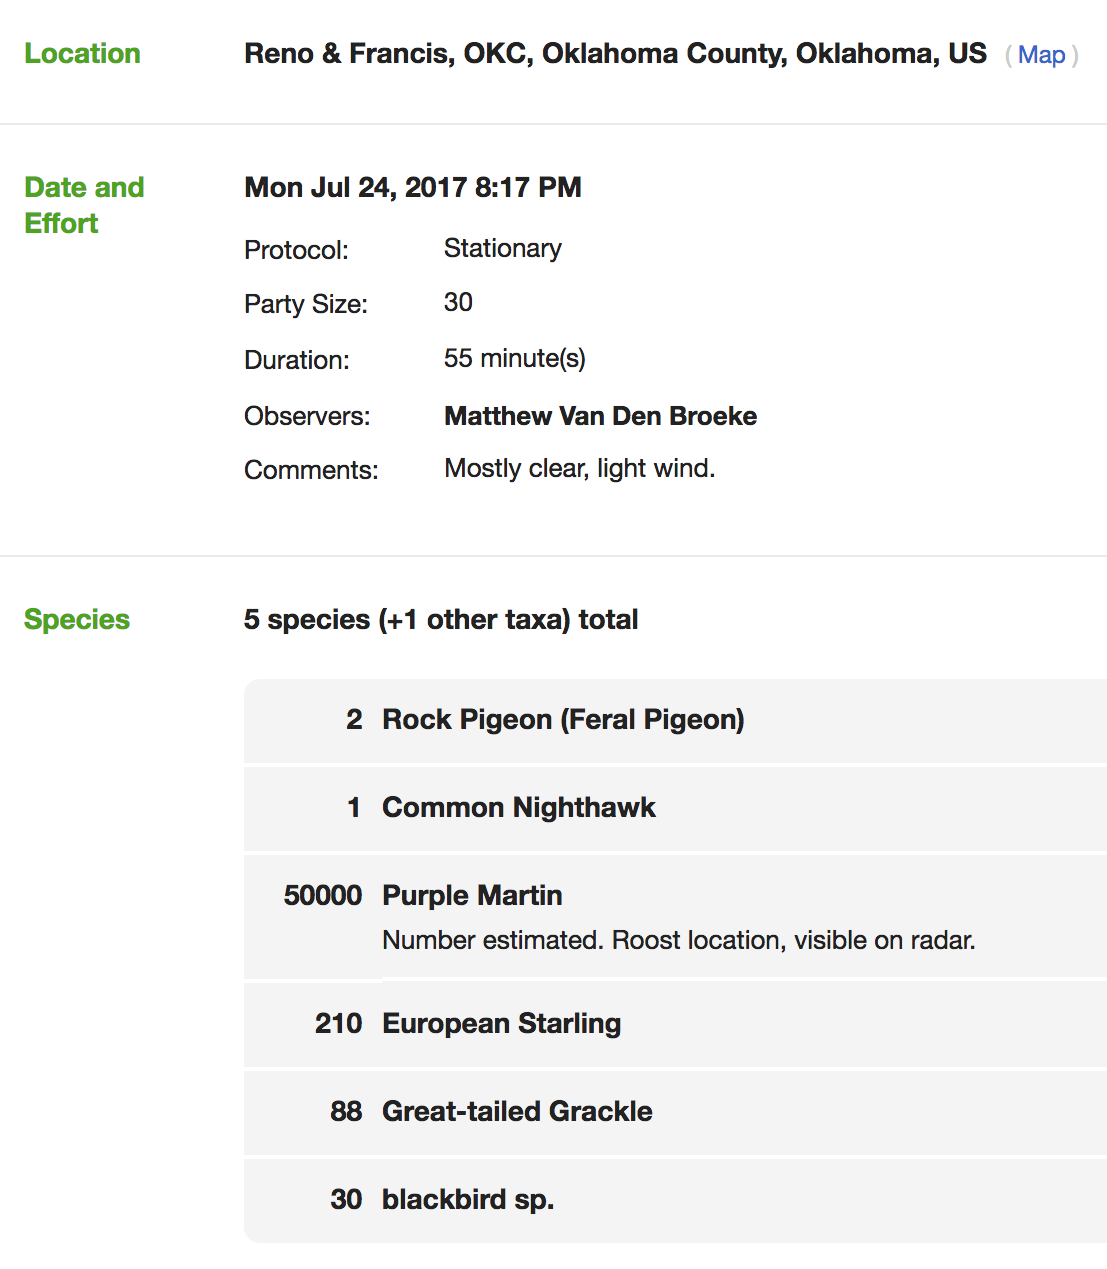 Van Den Broeke’s eBird checklist from July 24th, 2017. |
 Look to the upper left to see 50,000 Purple Martins caught on radar in Oklahoma City. (Base reflectivity radar imagery from July 25th, 2017.) |
–
Compiled by Birdcasters Carley Eschliman (text) and Kyle Horton (imagery).
This research was supported by funding from the National Science Foundation, Leon Levy Foundation, and NASA. Additional funding was provided by the Edward W. Rose Postdoctoral Fellowship at the Cornell Lab of Ornithology, Marshall Aid Commemoration Commission in the United Kingdom, and Amazon Web Services Cloud Credits for Research. The BirdCast project is a collaboration among the Cornell Lab of Ornithology, University of Massachusetts Amherst, and Oregon State University, and was funded by grants from the National Science Foundation and Leon Levy Foundation.
–
To learn more about our research team, check out our BirdCast staff bios here.
For live migration maps made by the BirdCast team, click here.
We love talking about our research! For media contacts, send our public relations department an email.